How to Calculate Cold Email Reply Rate: The Formula and the Mistakes That Inflate It
Your dashboard says your cold email reply rate is 9%, and you are about to report that number to your team. Before you do, ask a harder question: 9% of what, and does every one of those replies actually count? Most teams learn how to calculate cold email reply rate from whatever their sending tool prints on a chart, and that number is almost always wrong in a way that flatters the campaign.
This guide gives you the exact formula, the two decisions that quietly change the result by several points, and the noise you need to strip out before the number means anything. Get this right and every downstream metric, from positive reply rate to meetings booked, sits on solid ground.
The cold email reply rate formula
At its simplest, reply rate is one division:
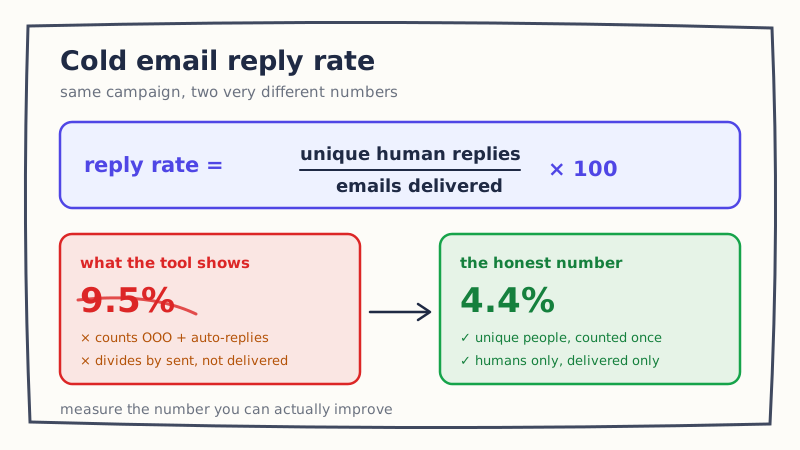
Reply rate = (replies / emails delivered) × 100
That looks obvious, and that is exactly why it goes wrong. Two words in that formula are doing more work than they appear to: “replies” and “delivered.” Change your definition of either one and the same campaign can read as a 5% reply rate or a 12% reply rate. The formula is not the hard part. The definitions are.
So the real question is not “what is the formula” but “what goes in the numerator and what goes in the denominator.” Let us take them one at a time.
Denominator: delivered, not sent
The first mistake is dividing by emails sent instead of emails delivered.
Sent counts every message you pushed out. Delivered counts only the ones that landed in an inbox. The difference is your bounces: invalid addresses, full mailboxes, and hard rejections. Those people never had the chance to reply, so including them in the denominator understates your reply rate and punishes you for a list-hygiene problem rather than a messaging problem.
Use delivered. If you send 1,000 emails and 60 bounce, your denominator is 940, not 1,000. This keeps reply rate as a measure of how persuasive your message was to people who actually received it, which is the thing you are trying to improve. Bounce rate is a separate metric with its own fix, and mixing the two hides both.
Numerator: what actually counts as a reply
This is where most reply rate numbers fall apart. Your sending tool counts anything that arrives in the thread as a reply. A human deciding to write back is a reply. The following are not, even though tools routinely count them:
- Out-of-office auto-responses. “I am away until Monday” is a mail server talking, not a prospect. It signals nothing about interest.
- Automatic acknowledgements. “We received your message and will respond within 48 hours” is a ticketing system, not a person.
- Bounce and delivery-failure messages that land back in the thread as if they were replies.
- Unsubscribe and “remove me” one-liners, which are arguably replies but are negative by definition. Count them if you want an honest total, but never let them pad a number you present as engagement.
If you leave out-of-office and auto-acknowledgements in your numerator, you inflate reply rate precisely when you are emailing large, enterprise-heavy lists, because those audiences generate the most automated noise. That is the opposite of what you want, since it makes your least human data look like your most engaged.
The fix is to separate genuine human replies from automated system messages before you count. Doing that by hand across hundreds of threads is where most teams give up and just trust the tool. This is exactly the triage the inbox agents in Underfive’s Unified Inbox are built to do: read every response as it lands, tell a real human reply apart from an out-of-office bounce, and route only the ones that matter. When the machine handles classification, your reply rate is measuring humans again instead of mail servers.
Unique reply rate vs total reply rate
The second definition decision is whether you count replies or repliers.
One engaged prospect might send four messages in a thread: a question, a follow-up, a “sounds good,” and a scheduling note. If your numerator counts every message, that single interested person shows up as four replies and your rate balloons. That is total reply rate, and it is close to meaningless because a handful of chatty threads can dominate it.
Unique reply rate counts each person once, no matter how many times they wrote. It answers the question you actually care about: of the people who received my email, how many decided to engage at all. Unique reply rate is the number to report and to optimize. Total reply count is fine for gauging conversation volume and workload, but do not confuse it with reach into your audience.
Reply rate vs response rate: the terminology trap
You will see “reply rate” and “response rate” used as if they mean the same thing, and sometimes they do. But some tools and teams use “response rate” to mean any action, including clicks, and “reply rate” to mean written replies only. Before you benchmark yourself against a number you read somewhere, confirm which definition it uses. Comparing your written-reply-only rate against someone else’s clicks-included response rate is how teams talk themselves into thinking they are behind, or ahead, when they are just measuring different things.
Pick one definition, write it down, and apply it everywhere. Consistency inside your own reporting matters more than matching any external label.
A worked example
Run one campaign through the whole process so the adjustments are concrete.
- Emails sent: 1,000
- Bounced: 60, so delivered = 940
- Messages that arrived in threads: 95
- Of those 95: 30 were out-of-office, 8 were auto-acknowledgements, 5 were bounce notifications, and 52 were genuine human messages
- Those 52 human messages came from 41 distinct people
The naive number your tool might show: 95 / 1,000 = 9.5%.
The honest number: 41 unique human repliers / 940 delivered = 4.4%.
Same campaign, and the real figure is less than half of the flattering one. The 4.4% is the number that will actually predict how many meetings you book, because it counts only people, only once, against only those who could have replied. Everything you build on top of reply rate, including positive reply rate, depends on starting from this clean base.
What is a good reply rate once you measure it correctly
Once you are measuring honestly, the natural next question is whether 4.4% is good. The answer depends heavily on your industry, list quality, and offer, which is why a single universal benchmark is misleading. We break the ranges down by vertical in our cold email reply rate benchmarks for 2026, and it is worth calibrating against your own segment rather than a headline average.
One caution: do not chase reply rate by comparing it to open rate, because open rate has its own accuracy problems in 2026. If you are still leaning on opens to judge campaign health, read why open rate lies and reply rate does not before you set targets. Reply rate is the number that survives scrutiny, which is exactly why it is worth calculating carefully.
Turn a clean reply rate into pipeline
Calculating reply rate correctly is the measurement half. The other half is acting on the replies fast enough that the effort pays off. A reply is a person raising their hand, and the value of that signal decays by the hour. If your honest reply rate is 4.4% and half of those people never get a same-day response, you are quietly halving the metric you just worked to measure accurately.
That is the loop worth closing: measure reply rate the right way, then make sure every genuine reply gets triaged and answered while the prospect is still paying attention. Underfive reads incoming replies, separates the humans from the auto-responders, and drafts or sends context-aware answers in minutes, so the reply rate you calculate actually turns into booked meetings. If you want to see how the classification and response layer works, take a look at what Underfive does, then go recompute your reply rate with delivered, unique, human-only numbers. The real figure is the one worth improving.